
Microsoft Azure Diagram: Types, Examples, Icons, and How to Create One
A Microsoft Azure diagram is a visual representation of an application, infrastructure, network, data flow, or cloud architecture built with Microsoft Azure services. It shows how Azure resources and external systems connect, communicate, and work together.
An Azure diagram can be as simple as a high-level view of a web application or as detailed as a production architecture showing networks, subnets, private endpoints, identity, databases, monitoring, security controls, and data flows.
For architects and engineering teams, a good Azure diagram is more than a collection of Azure icons. It should communicate what the system does, which components are involved, how traffic and data move, and where important boundaries and dependencies exist.
Microsoft's Azure Architecture Center provides reference architectures, solution ideas, technology decision guides, and architecture guidance that can be used when designing Azure workloads.
Cloud Architecture
Create cloud architecture diagrams for AWS, Azure, GCP, and more. Design scalable infrastructure with professional cloud icons.
Learn how to create a Microsoft Azure diagram with architecture examples, official Azure icons, diagram types, best practices, templates, and modern diagramming tools.
Click Cloud Architecture to open AI Line Studio and generate diagrams from natural language in seconds.
What Is a Microsoft Azure Diagram?
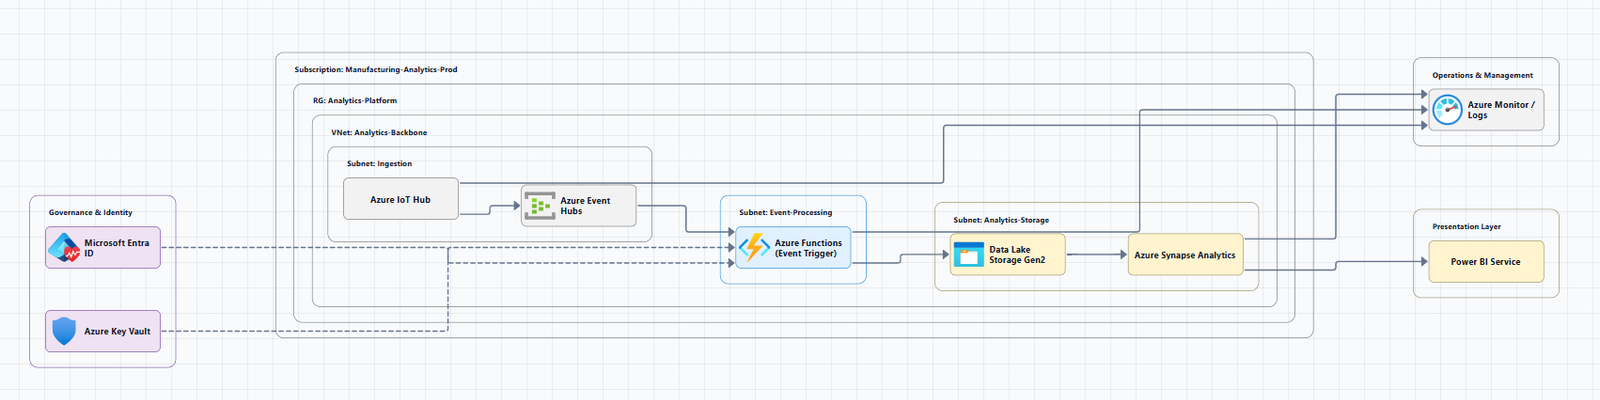
A Microsoft Azure diagram is a visual model of an Azure-based solution.
It typically uses Azure service icons, containers, connectors, labels, network boundaries, and other visual elements to explain relationships between components.
For example, a basic web application architecture might show:
Users → Azure Front Door/Application Gateway → Azure App Service → Azure SQL Database
A more complete production architecture could additionally show Azure Virtual Network, subnets, network security controls, private endpoints, Microsoft Entra ID, Azure Key Vault, Azure Storage, Azure Monitor, Application Insights, availability zones, external APIs, and CI/CD infrastructure.
The right level of detail depends on the question the diagram is supposed to answer.
Microsoft's current architecture guidance specifically recommends using different diagram types and progressively layering detail rather than trying to put an entire workload into one overloaded diagram. See Microsoft's guide to Azure architecture design diagrams.
Why Are Azure Architecture Diagrams Important?
Azure environments can contain dozens or hundreds of interconnected resources. Looking at resource names alone does not provide the same understanding as seeing their relationships visually.
An Azure architecture diagram can help teams:
- Explain a cloud architecture to stakeholders
- Document production infrastructure
- Review architecture before deployment
- Identify dependencies
- Explain network traffic
- Communicate security boundaries
- Plan application migrations
- Support troubleshooting
- Document disaster recovery designs
- Review scalability and availability
- Create technical documentation
- Support architecture and design reviews
A diagram is especially valuable when different audiences need different levels of detail.
For example, an executive may only need to see users, applications, databases, and external systems. A network engineer may need to see VNets, subnets, routing, private endpoints, and network security controls.
Common Types of Microsoft Azure Diagrams
There is no single "correct" Azure diagram. The best diagram depends on what you need to communicate.
1. Azure Solution Architecture Diagram
A solution architecture diagram provides a high-level view of an entire Azure workload.
It may include users, applications, Azure services, databases, networking, external dependencies, identity, security, monitoring, and data flows.
This is often the best starting point for communicating an Azure solution to architects, developers, managers, and other stakeholders.
2. Azure Application Architecture Diagram
An application architecture diagram focuses on the components that make up an application.
Users
  |
  v
Application Gateway
  |
  v
Azure App Service
  |
  +----> Azure SQL Database
  |
  +----> Azure Blob Storage
  |
  +----> Azure Key Vault
  |
  +----> External API
This type of diagram is useful for application design, technical documentation, and development discussions.
3. Azure Network Diagram
An Azure network diagram focuses on connectivity.
It may show Azure Virtual Network, subnets, network security controls, VPN Gateway, ExpressRoute, Azure Firewall, Application Gateway, private endpoints, public endpoints, on-premises networks, peering, and internet traffic.
Network diagrams are particularly useful for infrastructure, security, and network engineering teams.
4. Azure Deployment Diagram
A deployment diagram explains where software components are deployed.
It can show production, staging, development, Azure regions, availability zones, virtual machines, containers, Kubernetes clusters, app services, databases, and supporting infrastructure.
This helps DevOps and platform teams understand deployment boundaries.
5. Azure Data Flow Diagram
A data flow diagram concentrates on how information moves through the architecture.
Customer
   |
   v
Web Application
   |
   v
API
   |
   +----> Processing
   |
   +----> Database
   |
   +----> Data Lake
Data-flow diagrams can be especially useful for security reviews, data governance, compliance, and troubleshooting.
6. Azure Microservices Architecture Diagram
                 API Gateway
                      |
        +-------------+-------------+
        |             |             |
        v             v             v
   User Service   Order Service  Payment Service
        |             |             |
        v             v             v
     Database      Database      Payment API
An Azure implementation could use services such as Azure Kubernetes Service, Azure Container Apps, Azure Service Bus, Azure SQL, Cosmos DB, or other Azure services depending on workload requirements.
7. Azure Security Architecture Diagram
A security diagram focuses on identity, authentication, authorization, network boundaries, encryption, secrets, security controls, monitoring, trust boundaries, and external access.
It can be used during security reviews and threat-modeling exercises.
8. Azure Hybrid Architecture Diagram
A hybrid Azure diagram shows how Azure connects with on-premises infrastructure or other environments.
On-Premises Data Center
        |
        | VPN / ExpressRoute
        |
        v
Azure Virtual Network
        |
   +----+----+
   |         |
   v         v
Application  Database
Services     Services
This type of architecture is common when organizations migrate workloads gradually instead of moving everything to Azure at once.
What Should a Microsoft Azure Diagram Include?
The exact components depend on the architecture, but a useful Azure diagram commonly includes the following.
| Element | What it communicates |
|---|---|
| Users/clients | Who interacts with the system |
| Azure services | Which cloud services are being used |
| Containers | Logical or network boundaries |
| Connections | Relationships between components |
| Arrows | Direction of traffic or data |
| Labels | Purpose of components and relationships |
| Regions | Geographic deployment location |
| Availability zones | Resiliency boundaries |
| VNets/subnets | Network segmentation |
| External systems | Dependencies outside Azure |
| Databases/storage | Data persistence |
| Identity services | Authentication and authorization |
| Monitoring | Observability and operational visibility |
| Security controls | Protection mechanisms |
Avoid putting every resource into one diagram simply because it exists. The purpose of an architecture diagram is communication, not inventory.
Azure Architecture Diagram Example
Consider a three-tier web application. A simplified Azure architecture could look like:
                         Internet
                            |
                            v
                  Azure Application Gateway
                            |
                            v
                    Azure App Service
                       /          \
                      /            \
                     v              v
             Azure SQL Database   Azure Blob Storage
                     |
                     v
               Azure Key Vault

                 Azure Monitor
                      |
                      v
             Application Insights
A production architecture would normally require more design decisions than this simplified example, including network isolation, private connectivity, identity, availability, scaling, backup and recovery, monitoring, security, cost, data residency, and external integrations.
The diagram should therefore represent the architecture that has actually been designed, rather than implying that one generic topology is appropriate for every application.
How to Create a Microsoft Azure Diagram
Creating an effective Azure diagram is easier when you design the information structure before drawing the visual elements.
Step 1: Define the purpose
Start by asking: What question should this diagram answer?
Examples: How does a user request reach the application? How does the application connect to the database? How is the workload secured? How does traffic move between networks? Where is data stored? How does the system recover from a failure?
One diagram should have a clear primary purpose.
Step 2: Identify the major components
List the major components before choosing icons. For a typical web application, this might include users, DNS, application gateway, application layer, database, storage, identity, monitoring, and external APIs.
Step 3: Establish boundaries
Group related resources. Possible boundaries include Azure subscription, resource group, region, virtual network, subnet, availability zone, application boundary, and trust boundary.
Containers make complex diagrams easier to read.
Step 4: Define relationships
Determine which components communicate with each other, then identify additional dependencies such as authentication, storage, secrets, messaging, or monitoring.
Step 5: Add directional arrows
Use arrows to make communication direction obvious.
Microsoft's current Azure architecture guidance recommends clear directional arrows and warns against ambiguous lines and unnecessary bidirectional arrows.
Application ───────> Database is easier to understand than Application ─────── Database.
Step 6: Add official Azure icons
Microsoft provides an official collection of Azure architecture icons for architecture diagrams and documentation. Microsoft recommends using icons to illustrate how products work together and placing the product name near the icon.
The current Microsoft icon library was updated in July 2026 and includes new Azure and Microsoft Foundry-related icons.
Download official Azure architecture icons
Step 7: Label the important relationships
Don't assume the reader knows what every connection means.
Application
     |
     | HTTPS
     v
API
     |
     | Private Endpoint
     v
Azure SQL
Labels can explain protocol, data type, authentication mechanism, network path, communication pattern, and synchronization behavior.
Step 8: Add architecture metadata
For diagrams used as long-term documentation, include useful metadata such as diagram title, scope, owner, version, last updated date, references, and a legend where necessary.
Microsoft's current architecture diagram guidance explicitly recommends metadata and version control for maintained architecture diagrams.
Step 9: Review the architecture
Before publishing the diagram, ask:
- Are all important components represented?
- Are arrows directional?
- Are network boundaries clear?
- Are service names accurate?
- Are the icons current?
- Are external dependencies visible?
- Are security boundaries understandable?
- Can a new engineer understand the diagram?
- Does the diagram still match the deployed architecture?
Azure Diagram Best Practices
A technically correct architecture can still be difficult to understand if the diagram is poorly designed.
Keep the visual hierarchy clear
The reader should immediately understand where the request starts, where it goes, which major components process it, where data is stored, and where external systems connect.
Use progressive detail
Instead of creating one enormous diagram, create multiple views:
- Level 1: System context
- Level 2: High-level architecture
- Level 3: Network architecture
- Level 4: Application components
- Level 5: Detailed data or security flow
This approach aligns with Microsoft's guidance to layer diagrams instead of overloading a single visual.
Use consistent notation
Keep consistent icon sizes, text styles, arrow styles, line weights, containers, labels, and color semantics.
Don't use ambiguous arrows
A line should communicate a relationship. An arrow should communicate direction. If two independent flows exist, use two directional arrows rather than relying on one ambiguous double-ended arrow.
Don't distort Azure icons
Microsoft's icon guidance says not to crop, flip, rotate, distort, or change the shape of Azure product icons.
Don't confuse architecture with inventory
A diagram containing 100 Azure resources is not automatically better than a diagram containing 20. The goal is to communicate architecture decisions and relationships.
Azure Diagrams and the Well-Architected Framework
An Azure diagram should represent more than functional components.
Architecture decisions should also consider Reliability, Security, Cost Optimization, Operational Excellence, and Performance Efficiency, the five pillars of the Azure Well-Architected Framework.
For example, a basic diagram might show Application → Database. A more useful production design may need to communicate application layer, primary data, cache, and backup/recovery.
The diagram itself does not prove that the architecture satisfies every Well-Architected recommendation. Instead, it gives the team a visual foundation for discussing those requirements.
Microsoft's architecture guidance emphasizes that workload design involves tradeoffs across the five pillars rather than optimizing one dimension in isolation.
Azure Architecture Diagrams and Design Patterns
Architecture diagrams become more useful when they represent deliberate design patterns rather than arbitrary collections of services.
Azure's Architecture Center maintains a catalog of Azure cloud design patterns addressing common distributed-system challenges. Microsoft recommends selecting patterns based on the problem and constraints being solved rather than selecting a pattern simply because a particular technology is being used.
For example, a workload may need to address caching, retry behavior, asynchronous messaging, circuit breaking, competing consumers, event-driven processing, or queue-based load leveling.
A diagram can make the chosen pattern easier to communicate to the engineering team.
Microsoft Azure Diagram Tools
There are several ways to create Azure diagrams.
Microsoft Visio
Visio can be used for traditional architecture and technical diagramming workflows. Microsoft's Azure icon library provides SVG files that can be used in diagramming tools including Visio.
General-purpose diagramming tools
Tools such as general canvas and diagram editors can be useful when teams need manual layout, collaboration, custom shapes, architecture documentation, flowcharts, and network diagrams.
AI-powered diagramming
AI-powered diagramming takes a different approach.
Instead of manually placing every component, an architect can describe an architecture in natural language and use the description as the starting point for a visual diagram.
For example: "Create a production Azure web application with Application Gateway, App Service, Azure SQL, Key Vault, private endpoints, monitoring, and a virtual network."
The generated diagram should still be reviewed by a qualified engineer. AI can accelerate visualization, but it should not replace architecture validation.
If you want to turn an Azure architecture description into a visual starting point, you can use AI Line Studio's Azure diagram generator.
For broader system designs, the AI architecture diagram generator supports architecture workflows beyond a single provider. You can also refine layouts with Azure architecture visualization in the AI canvas.
For related cloud diagrams, see AWS architecture diagrams and GCP architecture diagrams.
Azure Diagram Generator vs. Manual Diagramming
| Approach | Best for | Main advantage | Main limitation |
|---|---|---|---|
| Manual diagramming | Detailed architecture work | Maximum control | Can take significant time |
| Templates | Repeated architecture patterns | Faster starting point | May require customization |
| Official examples | Learning and reference | Shows established patterns | Not necessarily your architecture |
| AI diagram generation | Initial architecture visualization | Converts descriptions into visuals quickly | Requires human validation |
| Code-based diagrams | Version-controlled diagrams | Can fit engineering workflows | Requires technical setup |
The best approach depends on the purpose of the diagram. For a complex production architecture, manual review remains important regardless of the generation method.
Microsoft Azure Diagram Templates
Templates can help when you repeatedly create similar architecture documentation.
A useful Azure diagram template might contain an Azure boundary, region, virtual network, subnets, application tier, data tier, external systems, identity, monitoring, security controls, and a legend.
However, templates should be treated as starting points rather than architecture decisions. A generic three-tier Azure template should not automatically determine how your production system should be deployed.
Microsoft's Architecture Center is a better reference point when you need architecture examples tied to specific Azure workloads. Browse Microsoft Azure Architecture Center for reference architectures, solution ideas, and architecture guidance.
Azure Architecture Diagram Examples to Create
If you're building a collection of Azure architecture diagrams, these are useful examples to document:
- Azure 3-Tier Architecture, Presentation, application, and data layers with network boundaries and security
- Azure Web Application Architecture, Users, DNS, Application Gateway, App Service, database, storage, monitoring
- Azure Microservices Architecture, API gateway, microservices, containers, messaging, databases, observability
- Azure Kubernetes Architecture, AKS, ingress, services, pods, container registry, databases, networking, monitoring
- Azure Data Platform Architecture, Data ingestion, processing, storage, analytics, reporting
- Azure AI Architecture, Application, AI services, data sources, model layer, security, monitoring
- Azure Hybrid Cloud Architecture, On-premises infrastructure, connectivity, Azure VNet, Azure workloads, identity, data movement
- Azure Disaster Recovery Architecture, Primary region, secondary region, replication, failover, backup, recovery dependencies
Microsoft's Architecture Center currently provides a large catalog of Azure architecture examples that can be used as references when designing these types of workloads.
Common Azure Diagram Mistakes
- Putting everything into one diagram, Creates visual noise. Better: Create multiple diagrams for different questions.
- Using outdated Azure icons, Azure services and branding evolve. Better: Use Microsoft's current official icon library. The July 2026 update added new icons and updated Microsoft Foundry-related assets.
- Missing traffic direction, A connection without direction can be ambiguous. Better: Use clear directional arrows.
- Missing boundaries, Better: Use logical containers for VNet, subnet, region, or application.
- Overusing color, Better: Establish a consistent visual taxonomy.
- Incorrect architecture relationships, A visually attractive diagram can still be technically wrong. Better: Validate every important connection against the actual architecture and Azure documentation.
- Not updating the diagram, An outdated architecture diagram can be worse than no diagram. Better: Treat the diagram as a maintained technical artifact and record its version and update date.
Azure Diagram Checklist
Before publishing or presenting a Microsoft Azure diagram, use this checklist:
- Purpose of the diagram is clear
- Scope is defined
- Major components are included
- External dependencies are shown
- Network boundaries are clear
- Directional arrows are used
- Important relationships are labeled
- Azure service names are correct
- Official icons are used
- Icons are not distorted
- Security boundaries are understandable
- Data flows are clear
- Diagram isn't unnecessarily crowded
- Legend is included when required
- Owner/version/date are documented
- Diagram has been technically reviewed
Final Takeaway
A good Microsoft Azure diagram does more than display Azure service icons. It explains the architecture.
Start with the question the diagram needs to answer. Identify the important components and relationships, establish clear boundaries, use official Azure icons, show directional flows, and keep the visual hierarchy consistent.
For complex systems, use multiple diagrams rather than forcing every detail into one image. Microsoft's current architecture guidance recommends purposeful, layered diagrams that remain accurate and maintainable over time.
If you already know the architecture you want to visualize, an AI-powered Azure diagram generator can provide a faster starting point before you review and refine the design.
Generate an Azure architecture diagram with AI Line Studio
For broader cloud architecture workflows, explore the AI cloud architecture diagram generator.
Frequently Asked Questions
A Microsoft Azure diagram is a visual representation of an Azure-based application, infrastructure, network, data flow, or solution architecture. It shows Azure services, external systems, relationships, boundaries, and communication paths.