
Cloud Architecture Diagram With Explanation: Examples, Patterns & Best Practices
A cloud architecture diagram is a visual blueprint of a cloud-based system. It shows the major services, infrastructure components, network boundaries, data stores, and connections that work together to deliver an application or workload.
A good cloud architecture diagram answers three questions quickly:
- What components make up the system?
- How are those components connected?
- How does data or traffic move through the architecture?
For example, a simple web application might look like:
Users → Load Balancer → Application → Database
A production architecture may add CDN → WAF → Load Balancer → Application Tier → Database, along with networking, security, monitoring, logging, backups, and redundancy.
This guide explains how to read cloud architecture diagrams, understand their core components and layers, recognize common architecture patterns, create effective diagrams, and choose the right diagramming approach, including an AI cloud architecture diagram generator.
Cloud Architecture
Create cloud architecture diagrams for AWS, Azure, GCP, and more. Design scalable infrastructure with professional cloud icons.
Learn how to read and create cloud architecture diagrams with examples of three-tier, serverless, and hub-and-spoke architectures.
Click Cloud Architecture to open AI Line Studio and generate diagrams from natural language in seconds.
What Is a Cloud Architecture Diagram?
A cloud architecture diagram is a visual representation of a system deployed on one or more cloud platforms, such as AWS, Microsoft Azure, Google Cloud, or Oracle Cloud Infrastructure.
It shows how services and infrastructure are organized and how they communicate.
Typical components include compute, storage, databases, networking, load balancers, APIs, containers, serverless services, security controls, monitoring and logging, external systems, and users and clients.
The purpose of an architecture diagram is not to show every resource.
It is to communicate the structure and behavior of the system at the appropriate level of detail, enough information for someone to understand the system's structure and operation.
Why Cloud Architecture Diagrams Matter
Cloud environments can contain hundreds or thousands of resources.
A written description can explain individual components, but it is difficult to understand relationships between those components without a visual model.
Architecture diagrams help teams communicate system structure, data flow, network boundaries, security boundaries, dependencies, availability zones, regions, external integrations, failure domains, and deployment strategies.
They are commonly used during architecture reviews, cloud migrations, system design, security reviews, incident investigations, technical documentation, developer onboarding, disaster recovery planning, and stakeholder presentations.
A diagram can also expose architectural assumptions that are difficult to notice in text.
Core Components of a Cloud Architecture Diagram
Most cloud architectures can be understood through a few fundamental categories.
1. Users and Clients
The architecture starts with the systems interacting with the workload.
Examples include web browsers, mobile applications, desktop applications, APIs, IoT devices, internal applications, and external partners.
These components are usually placed at the edge of the diagram.
2. Compute
Compute resources execute application code.
Depending on the cloud provider and architecture, this might include virtual machines, containers, Kubernetes, serverless functions, and managed application platforms.
Examples include AWS EC2, Azure Virtual Machines, Google Compute Engine, Amazon EKS, Azure AKS, Google Kubernetes Engine, AWS Lambda, Azure Functions, and Google Cloud Run.
The right compute model depends on workload requirements rather than simply choosing the newest service.
3. Storage
Storage services hold application data and files.
Object storage is used for images, videos, documents, backups, data lakes, and static website assets. Examples: Amazon S3, Azure Blob Storage, Google Cloud Storage.
Block storage is often attached to virtual machines. Examples: Amazon EBS, Azure Managed Disks, Google Persistent Disk.
File storage provides shared filesystem-style access.
4. Databases
Cloud architectures commonly use several database models.
Relational databases are useful for structured transactional workloads. Examples: Amazon RDS, Amazon Aurora, Azure SQL Database, Cloud SQL, AlloyDB.
NoSQL databases are useful for workloads requiring flexible schemas or high-scale access patterns. Examples include DynamoDB, Azure Cosmos DB, and Firestore.
The architecture diagram should show the database type and, when relevant, its relationship to the application tier.
5. Networking
Networking connects the different components.
A cloud architecture diagram may include VPCs, VNets, subnets, route tables, load balancers, gateways, NAT, firewalls, VPN, private connectivity, and DNS.
Networking boundaries are especially important because they communicate where traffic can and cannot flow.
Internet
   │
   ▼
Load Balancer
   │
   ▼
Public Subnet
   │
   ▼
Private Application Subnet
   │
   ▼
Private Database Subnet
This simple structure already communicates an important security model.
6. Security and Identity
Security should not be treated as an afterthought added to the diagram at the end.
Depending on the architecture, include IAM, identity providers, security groups, network ACLs, firewalls, WAF, secrets management, encryption, key management, and security monitoring.
Security controls often span the entire architecture rather than belonging to a single application tier.
Security and management act as an architectural overlay that includes IAM, monitoring, logging, and governance.
7. Observability
Production architectures also need visibility.
Common observability components include metrics, logs, traces, alerts, dashboards, audit logs, and application monitoring.
A production diagram does not necessarily need every monitoring component, but important observability dependencies should be represented.
Understanding Cloud Architecture Layers
Cloud architectures are often easier to understand when separated into logical layers.
Infrastructure Layer
This includes the underlying cloud infrastructure abstraction: virtual networks, subnets, virtual machines, storage, and load balancers.
Platform Layer
Managed platforms reduce the amount of infrastructure developers need to operate.
Examples include managed databases, Kubernetes services, message queues, application runtimes, and serverless platforms.
Application Layer
This is where the application logic lives: web applications, APIs, microservices, background workers, and business services.
Management and Security Layer
These capabilities span the architecture: IAM, logging, monitoring, security, governance, policy, and configuration management.
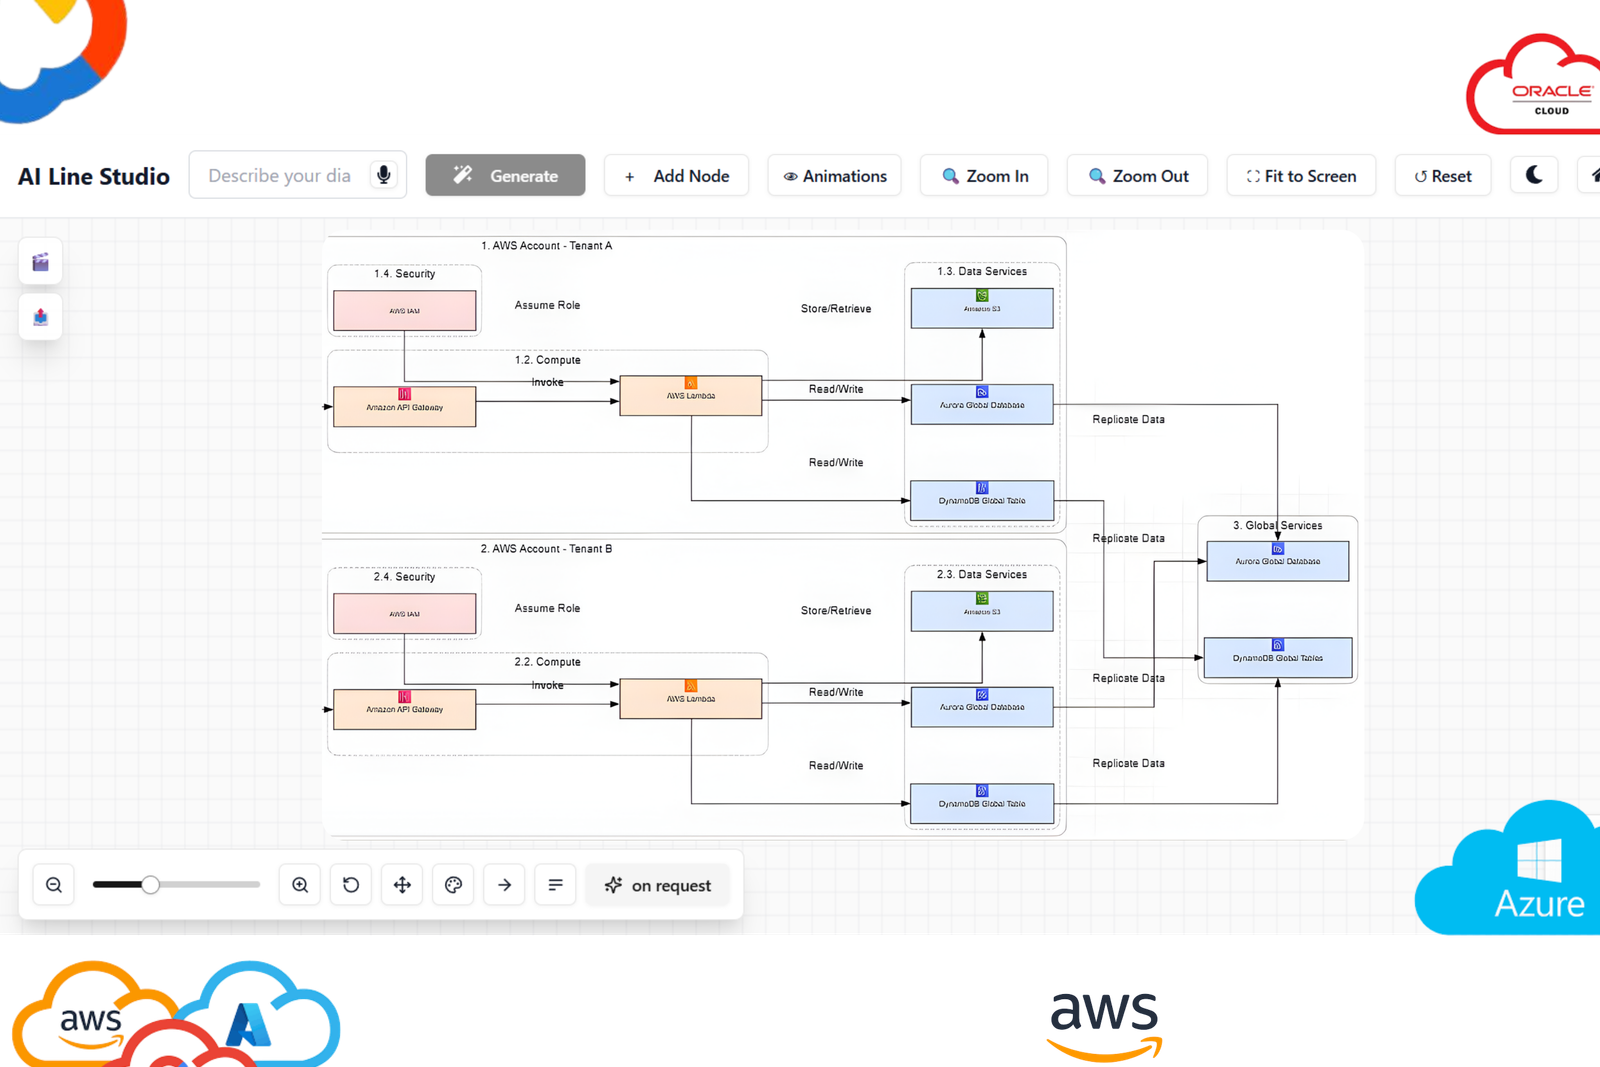
Common Cloud Architecture Patterns
Understanding common patterns makes architecture diagrams easier to read.
1. Single-Tier Architecture
Users
  │
  ▼
Single Server
 ├── Application
 └── Database
Useful for: Learning, prototypes, development, and small internal applications.
Limitations: As traffic, availability requirements, and operational complexity increase, a single-tier design can become difficult to scale and maintain.
2. Three-Tier Architecture
Three-tier architecture separates an application into presentation, application, and data tiers.
                 Users
                   │
                   ▼
          Load Balancer / CDN
                   │
                   ▼
          Presentation Tier
                   │
                   ▼
           Application Tier
                   │
                   ▼
               Data Tier
Three-tier architecture is one of the most common cloud patterns because separating tiers can allow teams to scale components independently, apply different security controls, separate responsibilities, isolate databases, and simplify maintenance.
Typical production implementation:
- AWS: CloudFront → ALB → EC2 Auto Scaling → RDS
- Azure: Front Door → Application Gateway → App Service/VMs → Azure SQL
- GCP: Cloud CDN/Load Balancing → Cloud Run/GKE → Cloud SQL
The exact services vary by workload.
3. Hub-and-Spoke Architecture
                 Central Hub
                /     |     \
               /      |      \
             VPC     VPC     VPC
             App     Data    Shared
The hub may contain shared capabilities such as firewall, VPN, DNS, network inspection, identity services, and shared connectivity.
This pattern is particularly useful for organizations managing multiple environments or teams. For multi-provider designs, see our multi-cloud architecture diagram guide.
4. Serverless Architecture
User
 │
 ▼
API Gateway
 │
 ▼
Function
 │
 ├──────► Database
 │
 └──────► Object Storage
Serverless architectures can be useful for event-driven applications, APIs, automation, variable workloads, and background processing.
However, serverless is not automatically cheaper or better. Evaluate invocation volume, execution duration, latency, state management, vendor dependencies, and operational requirements.
5. Microservices Architecture
                    API Gateway
                         │
        ┌────────────────┼────────────────┐
        │                │                │
        ▼                ▼                ▼
   User Service     Order Service    Payment Service
        │                │                │
        ▼                ▼                ▼
    Database          Database         Database
The diagram should make service boundaries and major communication paths visible.
Do not represent every internal implementation detail unless the diagram is specifically intended for service-level documentation.
6. Event-Driven Architecture
Application
     │
     ▼
Message Broker
     │
 ┌───┼────┐
 ▼   ▼    ▼
Svc A Svc B Svc C
Common components include queues, topics, event buses, consumers, producers, and event processors.
Event-driven architecture can reduce direct coupling between services, but it introduces additional concerns around event ordering, retries, duplicate messages, dead-letter queues, observability, and event schema management.
How to Read a Cloud Architecture Diagram
When looking at an unfamiliar architecture diagram, do not try to understand every icon at once.
Use a structured approach.
Step 1: Identify the users
Where does traffic originate? Look for users, applications, partners, and devices.
Step 2: Find the entry point
Identify the first cloud component receiving traffic: CDN, WAF, load balancer, API gateway, or application gateway.
Step 3: Follow the primary request path
Trace the arrows. For example: User → CDN → Load Balancer → Application → Database
This gives you the basic architecture before you investigate secondary systems.
Step 4: Identify network boundaries
Look for regions, VPCs, VNets, subnets, Availability Zones, and security boundaries.
Containers and boundaries help explain where components are deployed and what can communicate with what.
Icons, containers, connections, and labels are the main visual vocabulary of architecture diagrams.
Step 5: Find the data stores
Identify databases, object storage, caches, data warehouses, and data lakes, then determine which applications read or write to them.
Step 6: Look for supporting systems
Finally, identify monitoring, logging, security, messaging, external APIs, CI/CD, and identity services.
This prevents secondary components from distracting you from the primary request path.
Cloud Architecture Diagram Example
                         Internet
                            │
                            ▼
                      CDN / WAF
                            │
                            ▼
                    Load Balancer
                            │
              ┌─────────────┴─────────────┐
              │                           │
              ▼                           ▼
        Application 1              Application 2
              │                           │
              └─────────────┬─────────────┘
                            │
                            ▼
                       Database
A production version could add multiple Availability Zones, Auto Scaling, private subnets, NAT, security groups, secrets management, monitoring, backup, and disaster recovery.
The key is to add detail only when that detail helps the audience understand an architectural decision.
How to Create a Cloud Architecture Diagram
You can create a cloud architecture diagram manually, from infrastructure-as-code, or with AI-assisted diagramming.
Step 1: Define the purpose
Before opening a diagramming tool, decide what the diagram needs to communicate: high-level system overview, network architecture, security architecture, deployment architecture, data flow, disaster recovery, or application architecture.
One diagram rarely communicates every aspect well.
Step 2: Identify the Major Components
List users, applications, compute, databases, storage, networks, external systems, security, and observability.
Do not start by placing 100 icons on a canvas.
Step 3: Define the Data Flow
Determine who sends data to whom. For example: User → API → Application → Database
Then identify asynchronous flows: Application → Queue → Worker
Step 4: Add Network Boundaries
Show relevant regions, Availability Zones, VPCs, VNets, subnets, and private/public boundaries.
Step 5: Add Security Controls
Depending on the purpose of the diagram, show WAF, firewall, IAM, security groups, network policies, and secrets management.
Step 6: Add Reliability and Operations
For production architecture, consider multi-AZ deployment, replication, load balancing, Auto Scaling, backups, monitoring, alerting, and disaster recovery.
Step 7: Simplify
Now remove anything that does not help the intended audience understand the architecture.
A good architecture diagram is not a resource inventory.
Cloud Architecture Diagram Best Practices
- Use Official Cloud Icons, Use the current icon libraries from the relevant cloud providers. Official icons make diagrams easier for engineers familiar with AWS, Azure, or Google Cloud.
- Start With a High-Level View, Start with Users → Application → Data, then create more detailed views when required.
- Group Components by Logical Boundary, Use containers to represent cloud providers, regions, VPCs, VNets, Availability Zones, applications, and security domains.
- Make Data Flow Obvious, Use directional arrows and label different traffic types when needed.
- Label Components, Instead of a bare RDS icon, write Orders Database, Amazon RDS. Instead of a bare EC2 icon, write Application Servers, EC2 Auto Scaling.
- Explain Important Design Decisions, Annotations can explain why, for example: Multi-AZ deployment provides redundancy across Availability Zones.
- Include Metadata, For important architecture documentation, include diagram title, environment, owner, version, and last updated date.
Common Cloud Architecture Diagram Mistakes
- Mistake 1: Putting Everything on One Diagram, Create multiple views instead of one unreadable diagram.
- Mistake 2: Confusing Logical and Physical Architecture, Do not mix both levels without a clear reason.
- Mistake 3: Ignoring Security Boundaries, Production reviews need network and security boundaries.
- Mistake 4: Showing Services Without Data Flow, Relationships make the diagram useful.
- Mistake 5: Using Outdated Icons, Update diagrams when significant provider changes occur.
- Mistake 6: Overusing Colors, Color should communicate meaning, not decoration.
- Mistake 7: Treating the Diagram as the Source of Truth, Diagrams should complement infrastructure-as-code, configuration, monitoring, and documentation.
Choosing the Right Level of Detail
- Level 1: Context Diagram, Users → System → External Systems. Best for executives and stakeholders.
- Level 2: Logical Architecture, Applications, services, databases, major integrations. Best for engineers and architects.
- Level 3: Deployment Architecture, VPCs, subnets, Availability Zones, instances, load balancers, security boundaries. Best for cloud, DevOps, and infrastructure teams.
- Level 4: Detailed Infrastructure, Routes, security controls, dependencies, network flows, infrastructure resources. Best for troubleshooting, security reviews, and operations.
Tools for Creating Cloud Architecture Diagrams
There is no single best tool for every architecture workflow.
draw.io / diagrams.net is a strong option when you want manual control, free diagramming, cloud icon libraries, and offline/local workflows.
Diagram-as-Code tools such as Mermaid, PlantUML, and Python-based diagramming can be useful when architecture diagrams need to live alongside documentation or source code. The advantage is version control; the tradeoff is that visual customization may require code changes.
Infrastructure-as-Code-based diagramming can generate diagrams from Terraform or CloudFormation definitions, but may contain more implementation detail than an architecture review requires.
AI cloud architecture diagram generation changes the starting point: Architecture description → AI-generated diagram → Review → Refine.
For example:
Create a highly available three-tier web application on AWS. Use CloudFront and WAF at the edge, an Application Load Balancer across two Availability Zones, EC2 Auto Scaling in private subnets, and an RDS Multi-AZ database. Show the VPC, public and private subnets, security boundaries, and request flow.
The AI-generated diagram gives you a visual starting point. It should then be reviewed by an engineer or architect.
For broader cloud diagramming workflows, explore the cloud architecture diagram tool.
Create a Cloud Architecture Diagram With AI Line Studio
AI Line Studio currently supports natural-language-to-diagram generation for cloud and system architecture, along with structured cloud and enterprise icons, editing, collaboration, exports, and shareable documentation links.
The workflow is straightforward:
- Describe the architecture, Write the system in plain language.
- Generate the diagram, AI Line Studio currently describes its generation workflow as producing diagrams in approximately 15 to 20 seconds.
- Review the architecture, Check components, connections, network boundaries, data flow, security, and availability.
- Refine, Add or remove components and adjust the architecture as requirements change.
For AWS-specific architecture, use the AWS architecture diagram generator.
For Azure, use the Azure architecture diagram generator.
For GCP, use the GCP architecture diagram generator.
For architectures spanning multiple providers or technologies, use the AI architecture diagram generator.
For editing and organizing diagrams, use the AI diagram workspace.
AI-Generated Architecture Diagrams Still Need Review
AI is useful for reducing diagram creation effort. It does not eliminate architecture review.
Before using an AI-generated diagram as technical documentation, verify that services are appropriate, dependencies are correct, data flow is accurate, network boundaries are correct, public/private boundaries are correct, security controls are appropriate, failure domains are identified, redundancy is represented, and monitoring, logging, and alerting exist.
AI should accelerate visualization, not replace engineering judgment.
Cloud Architecture Diagram Decision Framework
| Diagram Type | Best For | Typical Detail |
|---|---|---|
| Context diagram | Stakeholders, executives | Low |
| Logical architecture | Architecture reviews | Medium |
| Network architecture | Cloud/network engineers | High |
| Deployment architecture | DevOps/platform teams | High |
| Security architecture | Security reviews | High |
| Data-flow diagram | Data and application teams | Medium, High |
| Disaster recovery architecture | Resilience planning | High |
Choose the diagram type based on the question you need the diagram to answer.
From Simple Cloud Diagram to Production Architecture
Beginner: Users → Application → Database
Intermediate: Add load balancing, network boundaries, subnets, security, and redundancy.
Production: Add only the operational detail needed to explain scaling, availability, failure handling, monitoring, security, CI/CD, backup and recovery, and cost-related architecture decisions.
The goal is not maximum detail. The goal is maximum clarity for the intended audience.
Create Your Cloud Architecture Diagram
A good cloud architecture diagram is not simply a collection of cloud service icons.
It should communicate: Components → Relationships → Data Flow → Boundaries → Design Decisions
Start with the simplest view that answers the question your audience has.
Then add detail for networking, security, reliability, observability, and deployment when the use case requires it.
If you want to create the first version from a written architecture description, try the AI cloud architecture diagram generator.
For a broader system design that may span cloud infrastructure, applications, and enterprise systems, use the AI architecture diagram generator.
For AWS-specific diagrams, use the AWS architecture diagram generator.
For Azure or GCP architectures, use the dedicated Azure architecture diagram generator or GCP architecture diagram generator.
You can then refine and organize the design in the AI diagram workspace.
The best architecture diagram is not the most detailed one. It is the one that makes the system easiest to understand, review, and maintain.
Frequently Asked Questions
A cloud architecture diagram is a visual representation of cloud infrastructure, applications, services, networks, data stores, and their relationships.