
Mermaid Azure Diagram: Examples, Code, and How to Create One
A Mermaid Azure diagram is an Azure architecture or infrastructure diagram represented using Mermaid's text-based diagram syntax. Instead of manually positioning shapes on a canvas, you describe services and relationships in code and let Mermaid render the visual.
This makes Mermaid useful for architecture as code, technical documentation, Git repositories, Markdown files, and engineering workflows where diagrams need to change alongside source code.
For example, a simple Azure web application can be represented with Mermaid like this:
graph LR
    User[Users] --> AppGW[Azure Application Gateway]
    AppGW --> App[Azure App Service]
    App --> SQL[Azure SQL Database]
    App --> Storage[Azure Blob Storage]
    App --> KeyVault[Azure Key Vault]
The important idea is that the diagram is stored as text. A developer can modify the architecture by changing the Mermaid source rather than manually moving shapes around a canvas.
Mermaid has dedicated architecture diagram syntax using architecture-beta, while Azure DevOps supports a documented subset of Mermaid diagram types in Markdown and Wiki content. The exact syntax you should use therefore depends on where the diagram will be rendered. See the Mermaid architecture diagram syntax.
Cloud Architecture
Create cloud architecture diagrams for AWS, Azure, GCP, and more. Design scalable infrastructure with professional cloud icons.
Learn how to create a Mermaid Azure diagram with practical code examples, Azure architecture patterns, Markdown, Azure DevOps guidance, and diagram-as-code best practices.
Click Cloud Architecture to open AI Line Studio and generate diagrams from natural language in seconds.
What Is a Mermaid Azure Diagram?
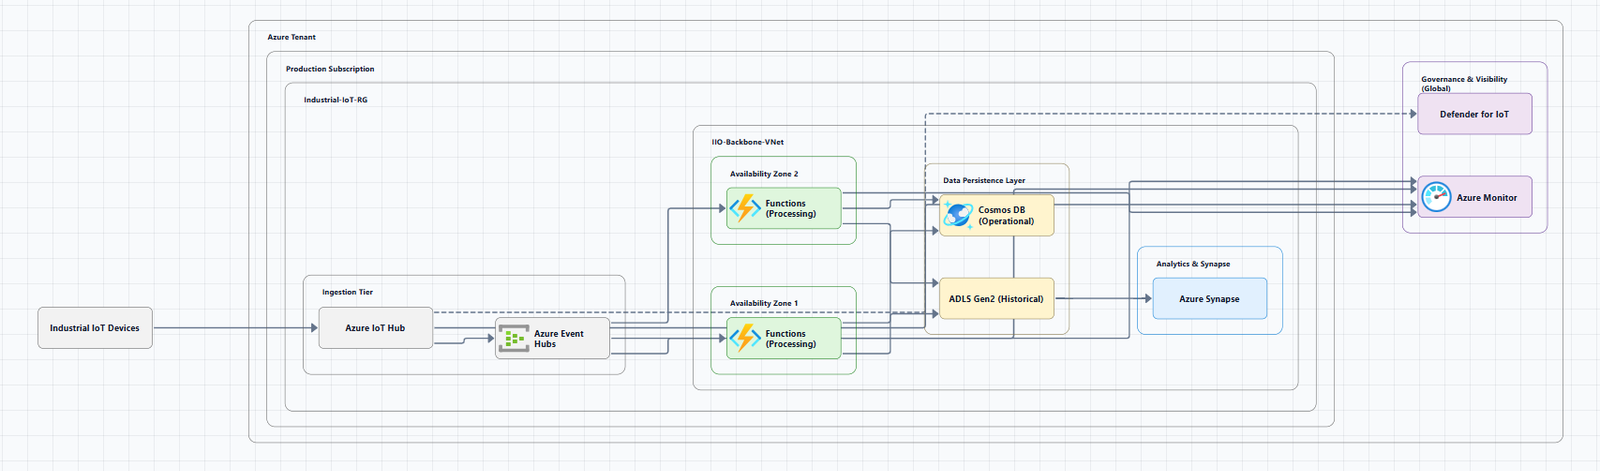
A Mermaid Azure diagram is a diagram that uses Mermaid syntax to represent an Azure architecture.
It can show relationships between services such as Azure Virtual Network, Azure Application Gateway, Azure App Service, Azure Functions, Azure SQL Database, Azure Storage, Azure Kubernetes Service, Azure Key Vault, Azure Firewall, Azure Monitor, and Microsoft Entra ID.
Mermaid itself does not automatically understand that a node named "Azure SQL Database" is an Azure resource. The architecture meaning comes from the labels, structure, and relationships you define.
graph TD
    Users[Users] --> Gateway[Azure Application Gateway]
    Gateway --> Web[Azure App Service]
    Web --> Database[Azure SQL Database]
The resulting visual communicates: Users → Application Gateway → Application → Database
That is the core value of using Mermaid for Azure architecture documentation.
Why Use Mermaid for Azure Architecture Diagrams?
Traditional architecture diagrams are often created manually using a graphical editor. That works well for detailed visual design, but it can become inconvenient when architecture documentation is maintained alongside code.
Mermaid provides a different workflow.
- Diagrams can be stored as text, in README files, architecture docs, design documents, Git repositories, Azure DevOps Wiki pages, and pull requests.
- Diagrams can be version controlled, changes can be committed to Git and reviewed through the same workflow as other documentation.
- Diagrams are easy to update, change relationships in text and re-render.
- Documentation stays closer to engineering workflows, GitHub, GitLab, Azure Repos, Azure DevOps, Markdown, VS Code, and CI/CD.
- Mermaid works well for lightweight architecture documentation, relationships, dependencies, flows, architecture structure, and component boundaries.
It is less appropriate when you need highly customized visual positioning or detailed official product iconography.
Mermaid Azure Diagram Syntax
Mermaid supports several diagram types. For Azure architecture documentation, the most useful starting point is usually a flowchart-style diagram.
graph LR
    User[User] --> App[Azure App Service]
    App --> DB[Azure SQL Database]
graph LR means the graph flows from left to right. Other useful directions include TB (top to bottom), BT (bottom to top), LR (left to right), and RL (right to left).
Mermaid Nodes for Azure Services
A Mermaid node can represent an Azure service. For architecture documentation, use the actual Azure service name rather than vague labels.
Prefer Azure Application Gateway over "Gateway" and Azure SQL Database over "Database". This makes the diagram understandable without requiring the reader to infer which Azure service you mean.
Mermaid Azure Architecture Diagram Example
graph LR
    User[Users] --> FrontDoor[Azure Front Door]
    FrontDoor --> AppGW[Azure Application Gateway]
    AppGW --> App[Azure App Service]

    App --> SQL[Azure SQL Database]
    App --> Storage[Azure Blob Storage]
    App --> KeyVault[Azure Key Vault]

    App --> Monitor[Azure Monitor]
This diagram represents a simplified architecture. It is not a universal production recommendation. The actual services and relationships should reflect the workload's requirements.
Mermaid Azure Network Diagram
graph TB
    Internet[Internet] --> AppGW[Azure Application Gateway]

    subgraph VNet[Azure Virtual Network]
        AppSubnet[Application Subnet]
        DataSubnet[Data Subnet]

        App[Azure App Service]
        SQL[Azure SQL Database]

        AppSubnet --> App
        DataSubnet --> SQL
    end

    AppGW --> AppSubnet
    App --> SQL
This gives the reader a conceptual view of internet ingress, virtual network, application subnet, data subnet, application, and database.
For more detailed network architecture, you may need additional boundaries and labels for private endpoints, network security groups, Azure Firewall, VPN Gateway, ExpressRoute, VNet peering, DNS, and routing.
Mermaid Azure Microservices Diagram
graph LR
    Client[Client] --> Gateway[API Gateway]

    Gateway --> UserService[User Service]
    Gateway --> OrderService[Order Service]
    Gateway --> PaymentService[Payment Service]

    UserService --> UserDB[User Database]
    OrderService --> OrderDB[Order Database]
    PaymentService --> PaymentDB[Payment Database]

    OrderService --> Bus[Azure Service Bus]
    Bus --> PaymentService
This makes service dependencies and messaging relationships explicit. You can replace generic services with Azure technologies such as Azure Kubernetes Service, Azure Container Apps, Azure Service Bus, Azure Functions, Azure SQL Database, or Azure Cosmos DB.
Mermaid Azure Kubernetes Architecture Diagram
graph TB
    User[Users] --> Ingress[Ingress]

    subgraph AKS[Azure Kubernetes Service]
        Ingress --> ServiceA[Frontend Service]
        Ingress --> ServiceB[API Service]

        ServiceB --> Worker[Worker Service]
    end

    ServiceB --> SQL[Azure SQL Database]
    Worker --> Queue[Azure Service Bus]
    AKS --> Monitor[Azure Monitor]
This diagram is intentionally simplified. A production AKS architecture may also need node pools, pods, ingress controller, Container Registry, managed identity, networking, private clusters, secrets, monitoring, and autoscaling, include those details only when relevant.
Mermaid Azure Serverless Architecture Diagram
graph LR
    User[User] --> API[Azure API Management]

    API --> Function[Azure Functions]

    Function --> Storage[Azure Blob Storage]
    Function --> Queue[Azure Service Bus]

    Queue --> Worker[Azure Functions Worker]

    Worker --> Database[Azure Cosmos DB]

    Function --> Monitor[Azure Monitor]
This makes the asynchronous relationship between components easier to understand.
Mermaid Azure Data Architecture Diagram
graph LR
    Source[Data Sources] --> Ingestion[Data Ingestion]
    Ingestion --> Processing[Data Processing]
    Processing --> Lake[Azure Data Lake Storage]
    Lake --> Analytics[Analytics]
    Analytics --> BI[Reporting]
Make the diagram more Azure-specific by replacing generic labels with the actual services used by the workload, for example Azure Data Factory, Event Hubs, Data Lake Storage, Databricks, Microsoft Fabric, Synapse, or Power BI.
Mermaid Azure Architecture With Subgraphs
graph TB
    Users[Users] --> Gateway[Application Gateway]

    subgraph AppLayer[Application Layer]
        Web[Azure App Service]
        Functions[Azure Functions]
    end

    subgraph DataLayer[Data Layer]
        SQL[Azure SQL Database]
        Storage[Azure Blob Storage]
    end

    Gateway --> Web
    Web --> Functions
    Functions --> SQL
    Functions --> Storage
Subgraphs help the reader distinguish entry points, application layers, data layers, network boundaries, security zones, regions, subscriptions, environments, microservices, and platform components.
Mermaid Azure Diagram With Regions
graph TB
    Users[Global Users] --> Global[Global Entry Point]

    subgraph EastUS[Azure East US]
        AppEast[Application]
        DBEast[Database]
    end

    subgraph WestUS[Azure West US]
        AppWest[Application]
        DBWest[Database]
    end

    Global --> AppEast
    Global --> AppWest

    AppEast --> DBEast
    AppWest --> DBWest

    DBEast <-->|Replication| DBWest
This is a conceptual diagram. A production multi-region architecture requires additional decisions around data replication, failover, traffic management, DNS, consistency, recovery objectives, state management, and regional dependencies.
Mermaid Architecture Diagram Syntax: architecture-beta
Current Mermaid documentation includes a dedicated architecture diagram syntax called architecture-beta.
The architecture diagram syntax is designed specifically around relationships between services and resources commonly found in cloud and CI/CD deployments. It uses concepts including groups, services, edges, junctions, and icons.
The syntax starts with architecture-beta and is documented by Mermaid for version 11.1.0 and later. See the Mermaid architecture diagram syntax.
architecture-beta
    group cloud(cloud)[Azure Cloud]

    service app(server)[Application] in cloud
    service db(database)[Database] in cloud

    app:R --> L:db
This approach is useful when you want a more structured architecture model than a basic flowchart.
Important Azure compatibility consideration
Do not assume that every Mermaid renderer supports every current Mermaid syntax feature.
This matters particularly when the target is Azure DevOps. Microsoft's current Azure DevOps documentation lists supported Mermaid diagram types and notes that Azure DevOps has limitations on Mermaid syntax. It specifically documents flowcharts using graph rather than the newer flowchart syntax. See Azure DevOps Mermaid diagrams.
Therefore, test the exact Mermaid syntax against the environment where your documentation will render.
Mermaid Azure Diagrams in Azure DevOps
This is one of the most useful applications of Mermaid Azure diagrams.
Azure DevOps supports Mermaid diagrams in Markdown and Wiki content. Microsoft's current documentation lists support for sequence diagrams, Gantt charts, flowcharts, class diagrams, state diagrams, user journeys, pie charts, requirements diagrams, Gitgraph, entity relationship diagrams, and timeline diagrams.
Microsoft also announced in May 2026 that Azure DevOps Markdown editors support the standard fenced Mermaid syntax in addition to the existing ::: mermaid syntax.
That means a Mermaid Azure diagram can live directly inside engineering documentation.
Azure DevOps Mermaid limitations
Azure DevOps does not necessarily support every Mermaid feature available in the latest Mermaid release. Microsoft's documentation specifically notes limitations around most HTML tags, Font Awesome, some newer syntax, flowchart syntax in favor of graph, certain arrow syntax, and some subgraph link behavior.
So if your diagram works in the Mermaid Live Editor but doesn't render in Azure DevOps, the issue may be renderer compatibility rather than your architecture.
Mermaid Azure Diagram in GitHub Markdown
Mermaid is also useful when Azure architecture documentation lives in a Git repository under /docs with files such as architecture.md, networking.md, security.md, and deployment.md.
This keeps the architecture close to the documentation and allows diagram changes to be reviewed through Git workflows.
Mermaid Azure Diagram vs. Traditional Diagramming
| Mermaid | Traditional visual diagramming |
|---|---|
| Text/code based | Canvas based |
| Git-friendly | Often file-based |
| Easy to diff | Visual changes can be harder to review |
| Excellent for documentation | Excellent for visual design |
| Fast for simple diagrams | Better for detailed positioning |
| Layout is renderer-driven | Layout can be manually controlled |
| Great for architecture-as-code | Great for presentation-quality diagrams |
Neither approach is universally better. Mermaid is especially useful when maintainability and version control are important. A visual architecture tool, including the AI canvas, is usually more appropriate when the diagram requires precise layout, official service iconography, presentation-quality design, or extensive manual editing.
Mermaid Azure Diagram vs. Azure Official Architecture Icons
These are two different things.
Microsoft provides an official Azure architecture icons library containing Azure product icons intended for architecture diagrams and documentation. Microsoft recommends using the product name close to the icon and says not to crop, flip, rotate, distort, or change the icon shape.
Mermaid, on the other hand, is a text-based diagramming language.
Mermaid gives you the diagram structure and relationships. Microsoft's Azure icon library gives you official Azure visual assets.
Do not assume that writing [Azure SQL Database] in Mermaid automatically produces Microsoft's official Azure SQL icon. If official Azure iconography is important to the final visual, use a diagramming workflow that explicitly supports those assets.
How to Create a Mermaid Azure Diagram
A reliable workflow when you want to create Azure architecture diagrams:
- Define the architecture, List services before writing Mermaid.
- Define relationships, Write the architecture as relationships.
- Select the Mermaid diagram type, Start with
graph LR; for supported environments, investigatearchitecture-beta. - Add boundaries, Use subgraphs to group application and data layers.
- Add labels, Make important relationships explicit (HTTPS, private connectivity, SQL).
- Validate the architecture, Mermaid validates syntax, not Azure correctness. Architecture validation remains an engineering responsibility.
Mermaid Azure Diagram Best Practices
- Use real Azure service names
- Keep the diagram focused on one purpose
- Use subgraphs for logical boundaries
- Keep arrows directional
- Label important relationships
- Keep code readable with meaningful IDs
- Test the renderer, especially Azure DevOps
- Keep architecture code with documentation
Microsoft's Azure architecture diagram guidance also emphasizes purposeful diagrams and clear relationships.
Common Mermaid Azure Diagram Mistakes
- Treating Mermaid as an Azure architecture validator, Mermaid renders diagrams; it doesn't validate Azure design.
- Using generic labels, Prefer Azure service names.
- Making the diagram too large, Split into context, application, network, data flow, and security views.
- Assuming all Mermaid features work everywhere, Azure DevOps documents limitations.
- Confusing Mermaid syntax with Azure icons, Official icons are separately distributed SVG assets.
- Optimizing for syntax instead of architecture, Valid Mermaid can still represent a poor architecture.
Mermaid Azure Diagram Checklist
- Azure service names are accurate
- Architecture relationships are correct
- Diagram direction is clear
- Important connections have labels
- Logical boundaries are visible
- The diagram isn't unnecessarily large
- Node IDs are meaningful
- Mermaid syntax renders correctly
- Target platform supports the syntax
- Azure DevOps compatibility has been tested if applicable
- Official Azure icons are used separately when required
- Security and network boundaries are represented where relevant
- External dependencies are shown
- Diagram source is version controlled
- Diagram matches current architecture
When Should You Use Mermaid for Azure Diagrams?
Mermaid is a strong choice for architecture documentation, Markdown diagrams, Git-based documentation, version-controlled diagrams, lightweight architecture visualization, developer-facing documentation, Azure DevOps Wiki diagrams, repository README diagrams, and diagrams that change frequently.
A visual diagramming tool is generally more suitable for precise positioning, official Azure iconography, presentation-quality architecture diagrams, complex visual styling, large diagrams with many custom elements, collaborative canvas editing, and non-technical stakeholder presentations.
The two approaches can also coexist: Mermaid for version-controlled technical documentation, and a visual diagram for architecture review and presentation.
Mermaid Azure Diagram Generators
Writing Mermaid code manually is useful when you understand the architecture and want precise control over the output.
But there is another workflow: Describe the architecture → generate the diagram → review the Mermaid/code or visual output → refine it.
For example, instead of manually starting with graph LR, you could describe: Create an Azure three-tier architecture with Application Gateway, App Service, Azure SQL Database, Blob Storage, Key Vault, and Azure Monitor. Group the application and data components separately and show the request flow.
An AI-powered diagramming workflow can use this description as the starting point. The important distinction is that AI-generated Mermaid code still needs technical review.
If the goal is to create a visual Azure architecture rather than maintain the architecture purely as text, an AI-powered Azure diagram generator can be used as a starting point.
For broader architecture work, an AI architecture diagram generator can be useful when the architecture isn't limited to Azure. You can also explore the AI cloud architecture diagram generator for multi-service cloud designs.
Mermaid Azure Diagram Tools
| Requirement | Mermaid | Visual diagram tool | AI diagram generator |
|---|---|---|---|
| Version control | Excellent | Depends on tool | Depends on output |
| Markdown | Excellent | Usually indirect | Depends on tool |
| Git workflow | Excellent | Moderate | Moderate |
| Manual positioning | Limited | Excellent | Varies |
| Official Azure icons | Not inherently | Often available | Depends on tool |
| Architecture-as-code | Excellent | Limited | Can assist |
| Rapid initial generation | Moderate | Moderate | Strong |
| Presentation design | Limited | Strong | Varies |
There is no need to force one tool into every workflow. The right approach depends on whether your priority is code maintainability, visual communication, automation, or speed.
A Practical Mermaid Azure Workflow for Engineering Teams
- Define, Write the architecture requirements.
- Model, Identify services, boundaries, relationships, data flows, and network paths.
- Generate, Create Mermaid source.
- Review, Validate service relationships, security, networking, availability, and data flows.
- Commit, Store the Mermaid source in Git.
- Publish, Render in GitHub, Azure DevOps, documentation platforms, or internal portals.
- Maintain, Update the diagram when the architecture changes.
This is where diagram-as-code becomes particularly useful: the architecture isn't trapped in a static image.
Conclusion
A Mermaid Azure diagram combines Azure architecture with a diagram-as-code workflow.
Instead of storing the architecture only as an image, you can represent services and relationships as text. That makes Mermaid particularly useful for engineering teams that maintain architecture documentation in Git, Markdown, GitHub, or Azure DevOps.
For Azure-specific work, remember the distinction between Mermaid syntax and Microsoft's official Azure architecture icons. Mermaid defines the diagram structure, while Microsoft separately provides Azure product icons and usage guidance.
Also consider the rendering environment before choosing Mermaid syntax. Azure DevOps supports Mermaid but documents its own compatibility limitations, while current Mermaid releases provide newer architecture syntax such as architecture-beta.
For simple, version-controlled technical documentation, Mermaid can be an excellent choice. For highly polished Azure architecture visuals using official service iconography, a visual diagramming workflow may be more appropriate.
And when you want to move from an architecture description to a visual Azure architecture quickly, an AI-powered Azure diagramming workflow can provide a useful starting point before the architecture is reviewed and finalized.
Frequently Asked Questions
A Mermaid Azure diagram is an Azure architecture or infrastructure diagram represented using Mermaid's text-based diagram syntax. It can show Azure services, relationships, network boundaries, data flows, and application dependencies.